Your Partner in Process Excellence

Process Capability & Performance Indices Cp, Cpk , Pp and Ppk
Cp (Process Capability)
Meaning:
Measures potential capability
Assumes process is centered
Interpretation:
Cp = 1 → Just meets specs
Cp > 1 → Good capability
Cp < 1 → Not capable
👉 Limitation: Ignores process shift
Cpk (Process Capability Index)
Meaning:
Measures actual capability
Considers process centering
Interpretation:
Cpk = Cp → Process perfectly centered
Cpk < Cp → Process shifted
Cpk < 1 → Defects likely
Pp (Process Performance)
Meaning:
Similar to Cp, but uses overall variation (s)
Includes long-term variation
Ppk (Process Performance Index)
Meaning:
Real-world performance including:
shifts
drifts
instability
Cp/Cpk vs Pp/Ppk
Cp --> Within variation (σ) --> Short-term capability
Cpk--> Within + centering --> Short-term actual capability
Pp --> Overall variation (s)--> Long-term performance
Ppk--> Overall + centering --> Real-world performance
Summary:
Cp-> Potential Capability (Precision of the Process)
Cpk-> Actual Capability (Accuracy of the Process)
Pp/Ppk-> Long term process behaviour
Industry Benchmark:
Cpk/Ppk < 1.0 --> Not Capable
Cpk/Ppk = 1.0 --> Bare minimum
Cpk/Ppk >=1.33 --> Acceptable
Cpk/Ppk>= 1.67 --> Good
Cpk/Ppk >=2.0 -> Excellent
Practical Example:
Cp = 1.5 but Cpk = 0.8 --> Process has potential but is off-center
Cpk = 1.4 but Ppk = 0.9 --> Process unstable over time
Cp=2.0 and Cpk=0.9 --> Process capable but badly centred
Cpk=1.5 and Ppk=1.0 --> Process unstable over time
Cpk=1.33 --> Good and acceptable
Ppk<1--> Customer likely seeing defects
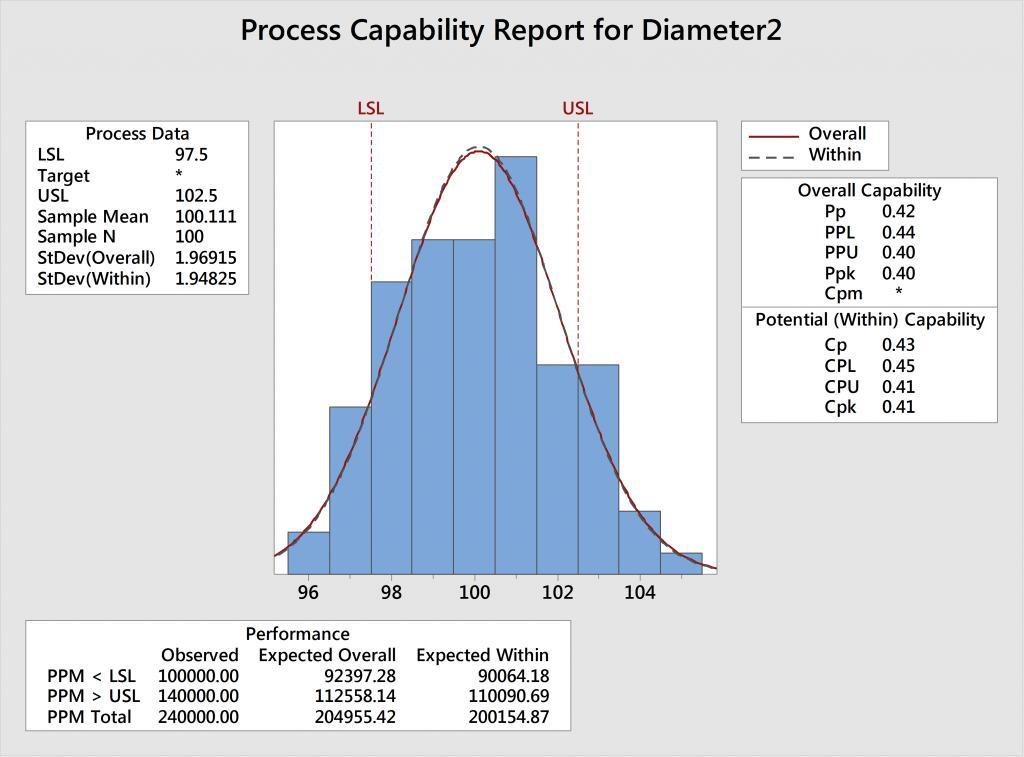
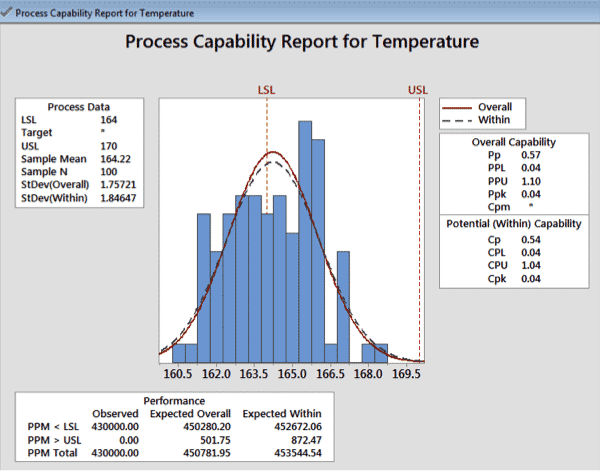
Sample Graphs
Contact
Ready to boost your maturity? Reach out.
Phone
© 2026. All rights reserved.
linked in