Your Partner in Process Excellence
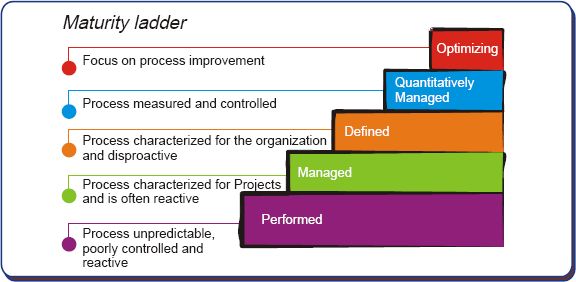
CMMI High Maturity
Processes & Tools used at Maturity Level 4 and 5
What is CMMI High Maturity
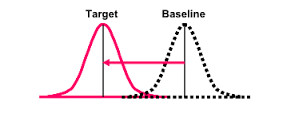
PPB (Process Performance Baselines)
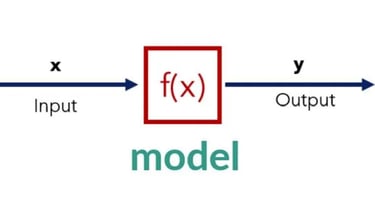
PPM (Process Performance Models)


Write a short text about your service
Write a short text about your service
Write a short text about your service


Why Should Your Organization Implement HM?
At CMMI maturity level 4, organisation and project objectives for quality and process performance are expressed quantitatively. At CMMI maturity level 5 organisations are able to react in a disciplined manner to change. So through a high maturity life the organizations could be able to understand the past, control the present and predict the future in a better way.
Key benefits from implementing HM are:
Clearly defined Business Objectives and a better visibility of Key performance indicators
Processes are optimized and aligned with the Business objectives of the organization
A culture of continuous improvement is institutionalized in the organization .
Statistical tools and techniques are used to measure variances in process performance and to minimize them.
Contact
Ready to boost your maturity? Reach out.
Phone
© 2026. All rights reserved.
linked in